

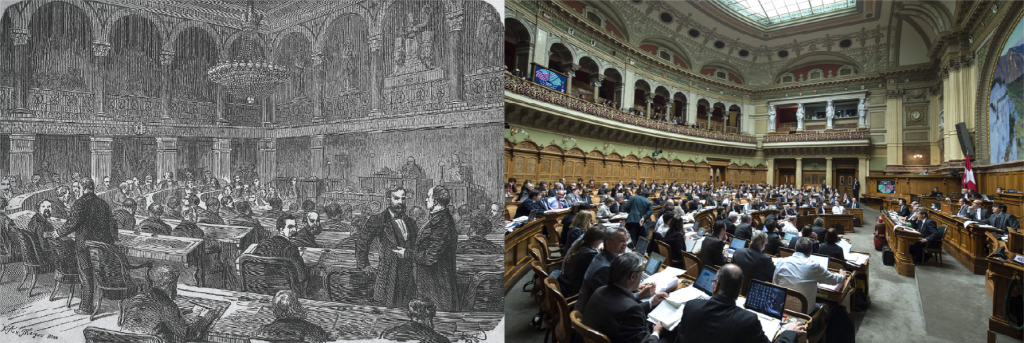
The Swiss Elite Observatory at the University of Lausanne has carried out an analysis of the profile of the new National Council following the last federal elections in 20231. The study also includes a comparison with the very first National Council in 1848, highlighting a number of highly stable elements.
1. Women’s presence: a lacklustre performance
After the 2019 federal elections, we saw the biggest increase in the number of women in the National Council since the introduction of women’s suffrage in 1971 (from 32 to 41.5%). In the federal elections on 22 October 2023, there is a fall of three percentage points. Women now account for 38.5% of the members of the House of the People. This drop is largely due to the success of the SVP, which initially had fewer women candidates on its electoral lists.
Even if the presence of women has fallen, from 83 elected in 2019 to 77 on the evening of 22 October 2023, it is nonetheless clear that, with the exception of the SVP, the centre-right parties (i.e., FDP and Centre) and the SP have renewed their representation by electing a significant proportion of women. In the case of the Centre and the SP, more than half were women.
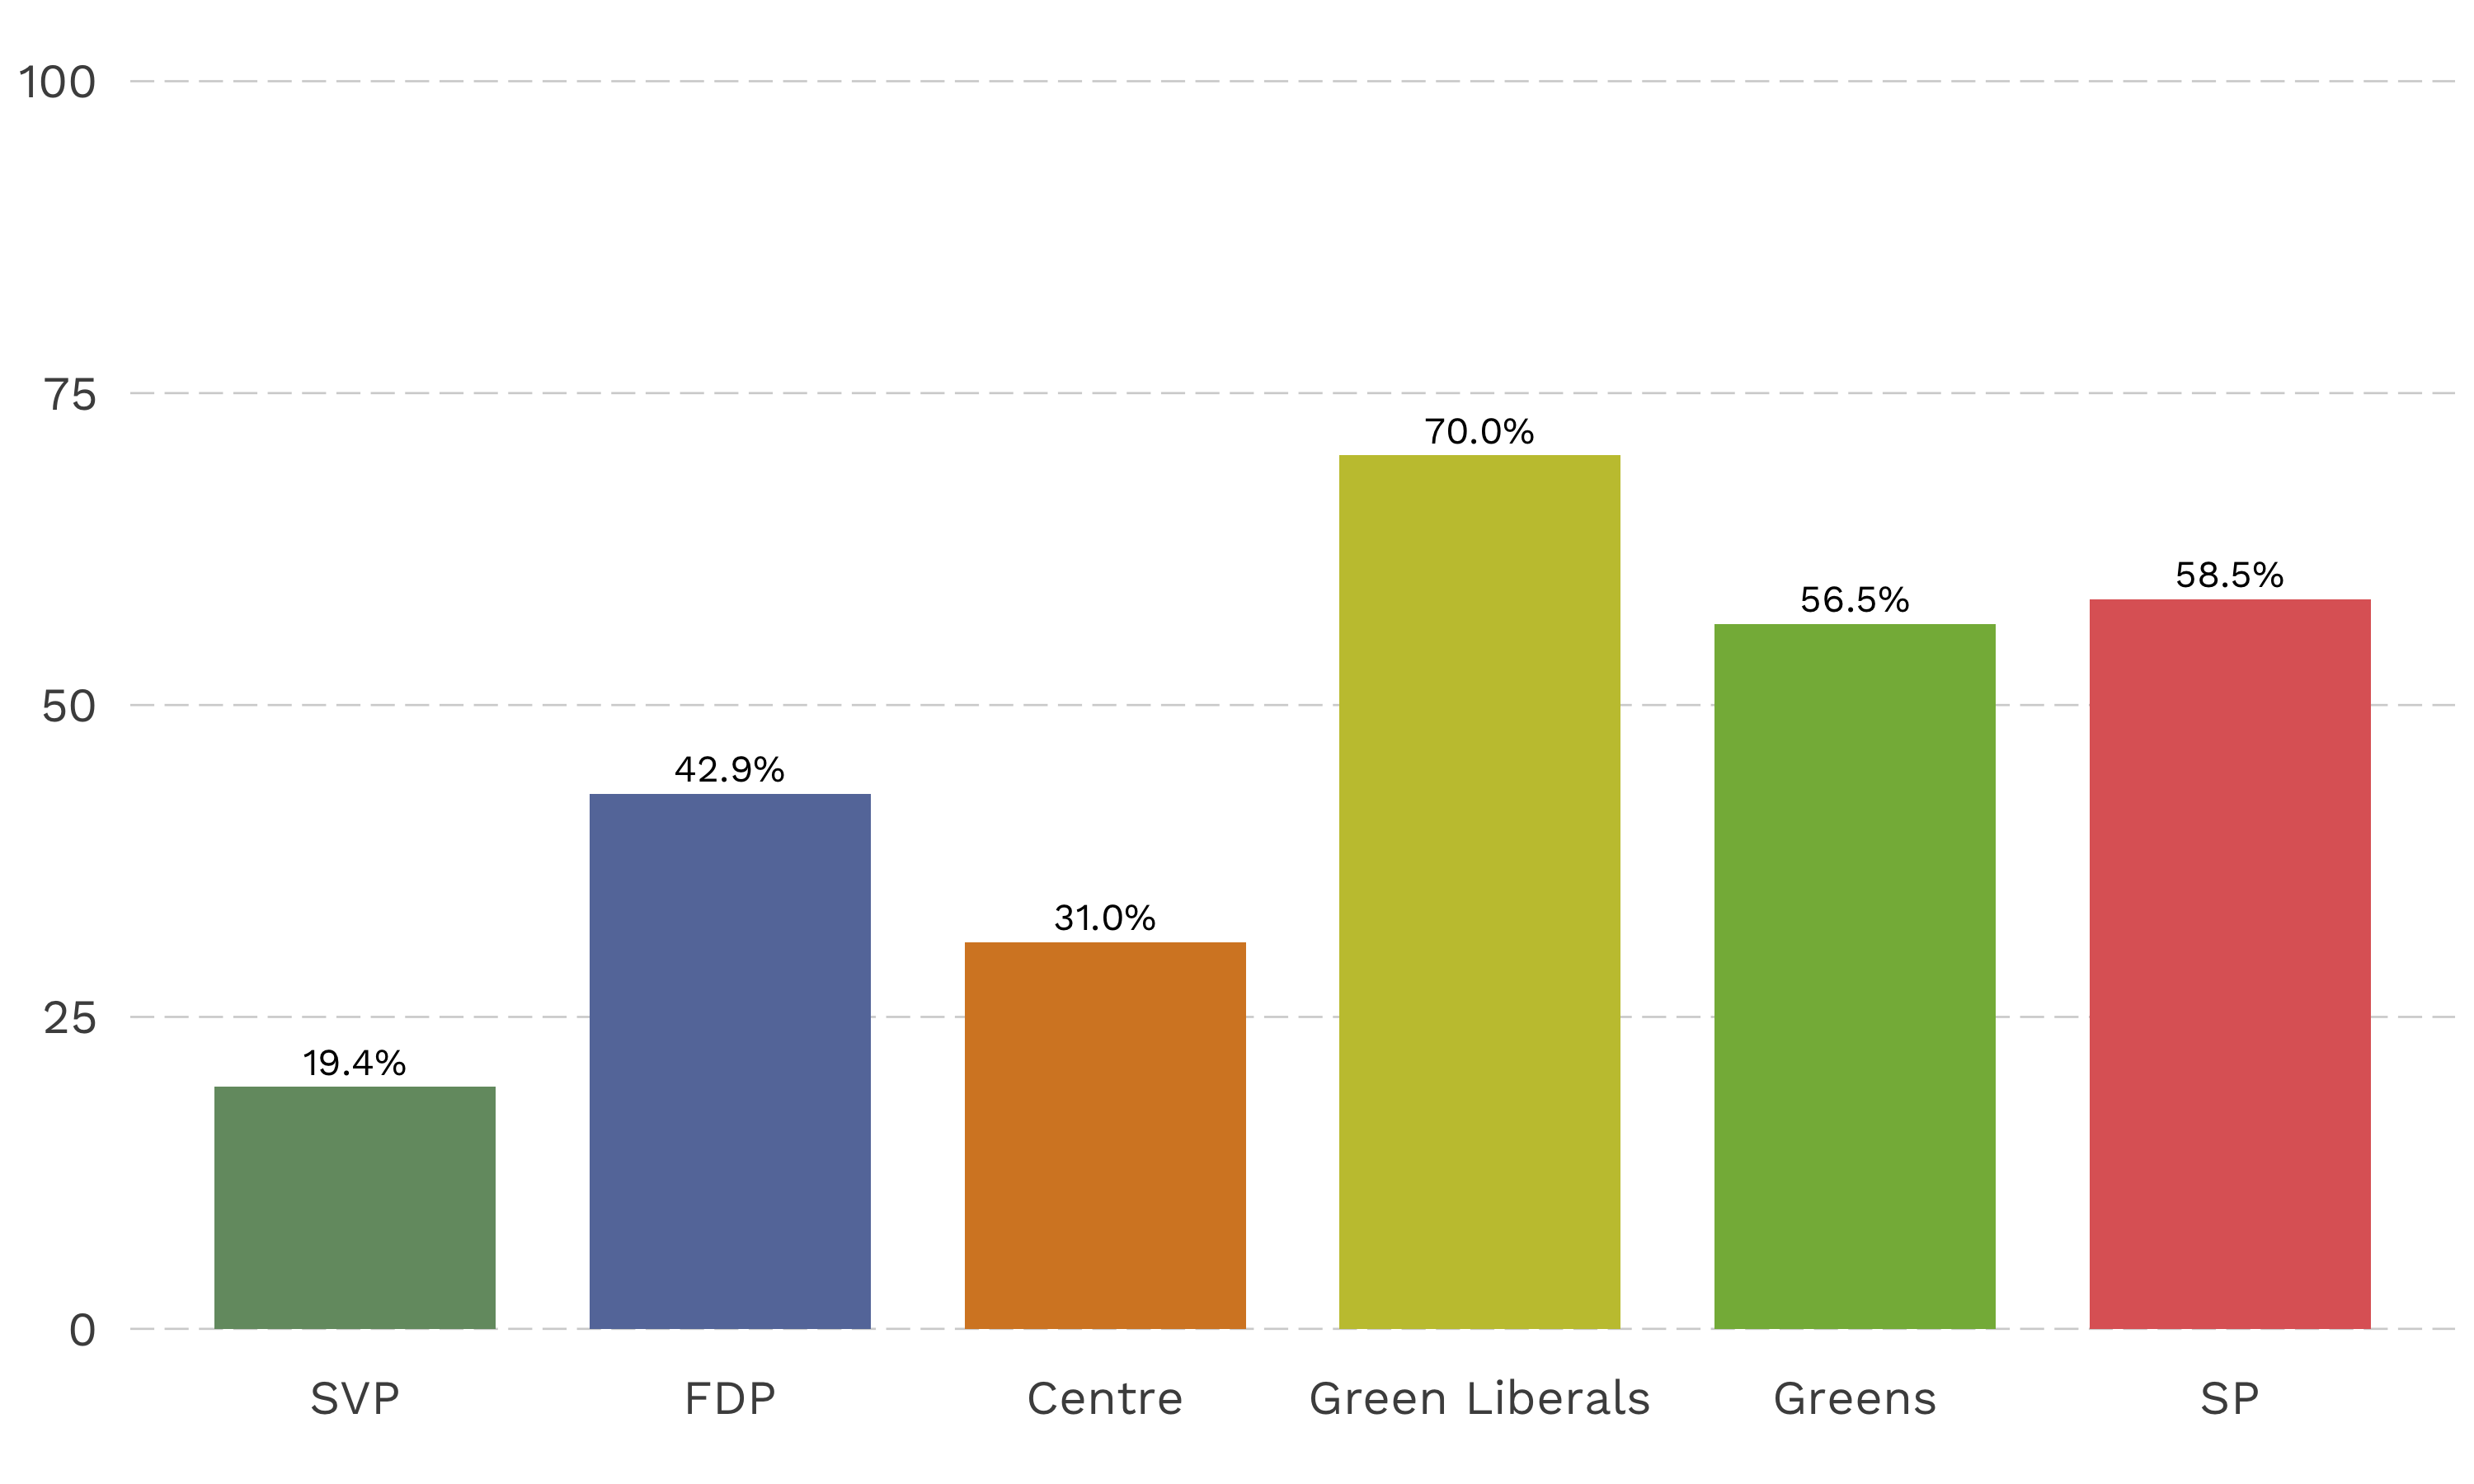
Following the last elections, the party delegations with the highest proportions of women in the new National Council were those of the Liberal Greens (70%), the SP (58.5%) and the Greens (56.5%). The other delegations, as in the last legislature, continue to fail to achieve true gender parity: 42.9% of the elected members of the PLR are women (up from 34.5% in 2019), 31% in the Centre (32% in 2019) and 19.4% in the UDC (24.5% in 2019) (Figure 1).
Figure 1. Women in partisan delegations in the National Council (2023), in %
There are significant differences in the socio-professional profile of women and men elected to the National Council. Female MPs have a lower average age and a higher proportion of university graduates than their male counterparts (in 2023, 68.8% vs. 51.2%) (Appendix 1). Among elected women, two professional groups predominate: professional MPs and other liberal professions (doctors, economic, legal, political or communications consultants, etc.). Among elected representatives, the most prevalent professions are company directors, farmers and lawyers (Appendix 3).
2. The National Council: a slightly “older” house
On the subject of the age of elected members, we note a slight “ageing” of the new National Council. This is illustrated by two indicators. Firstly, the average age has risen slightly, from 48.6 (2019) to 49.7. On the other hand, the group of MPs aged under 40 has decreased, while that aged 60 and over has increased (Figure 2).
Figure 2. Age distribution of the members of the National Council (1848 and 2015-2023), in %
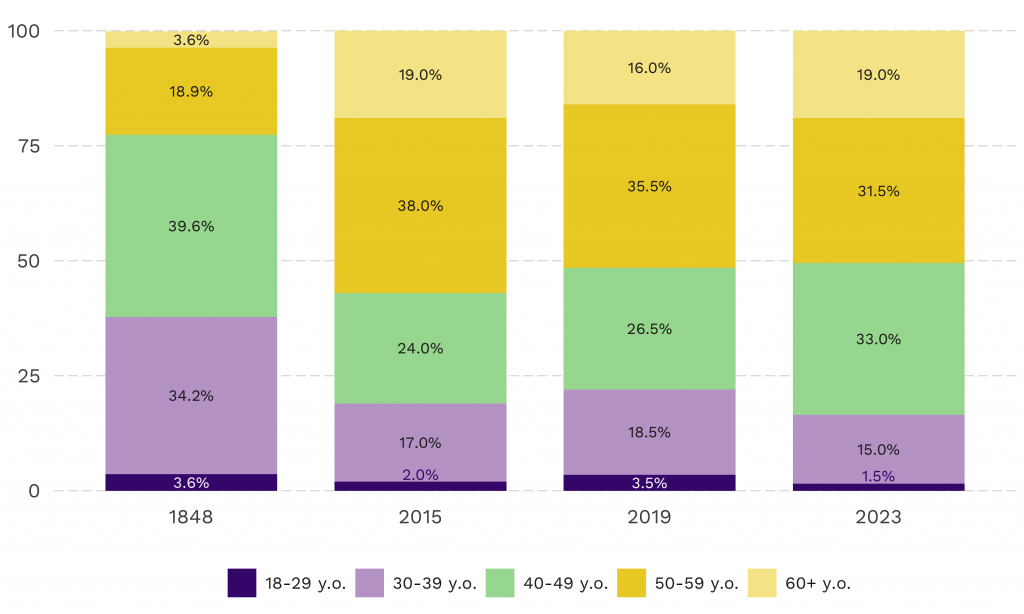
The fact that the very first National Council of 1848 had both a lower average age (43) and a large minority of elected members aged 50 and over (22.5% compared with 50.5% in 2023) can be explained by two reasons linked to the period in the middle of the 19th century. On the one hand, the birth of the federal state and a new political system also brought with it the arrival of a young political elite to replace the one that had characterised the previous period. On the other hand, it should be remembered that at that time the life expectancy of the population was lower than it is today and, as a result, this also partly influenced the age structure of the Swiss Parliament.
3. University education: a somewhat less indispensable asset
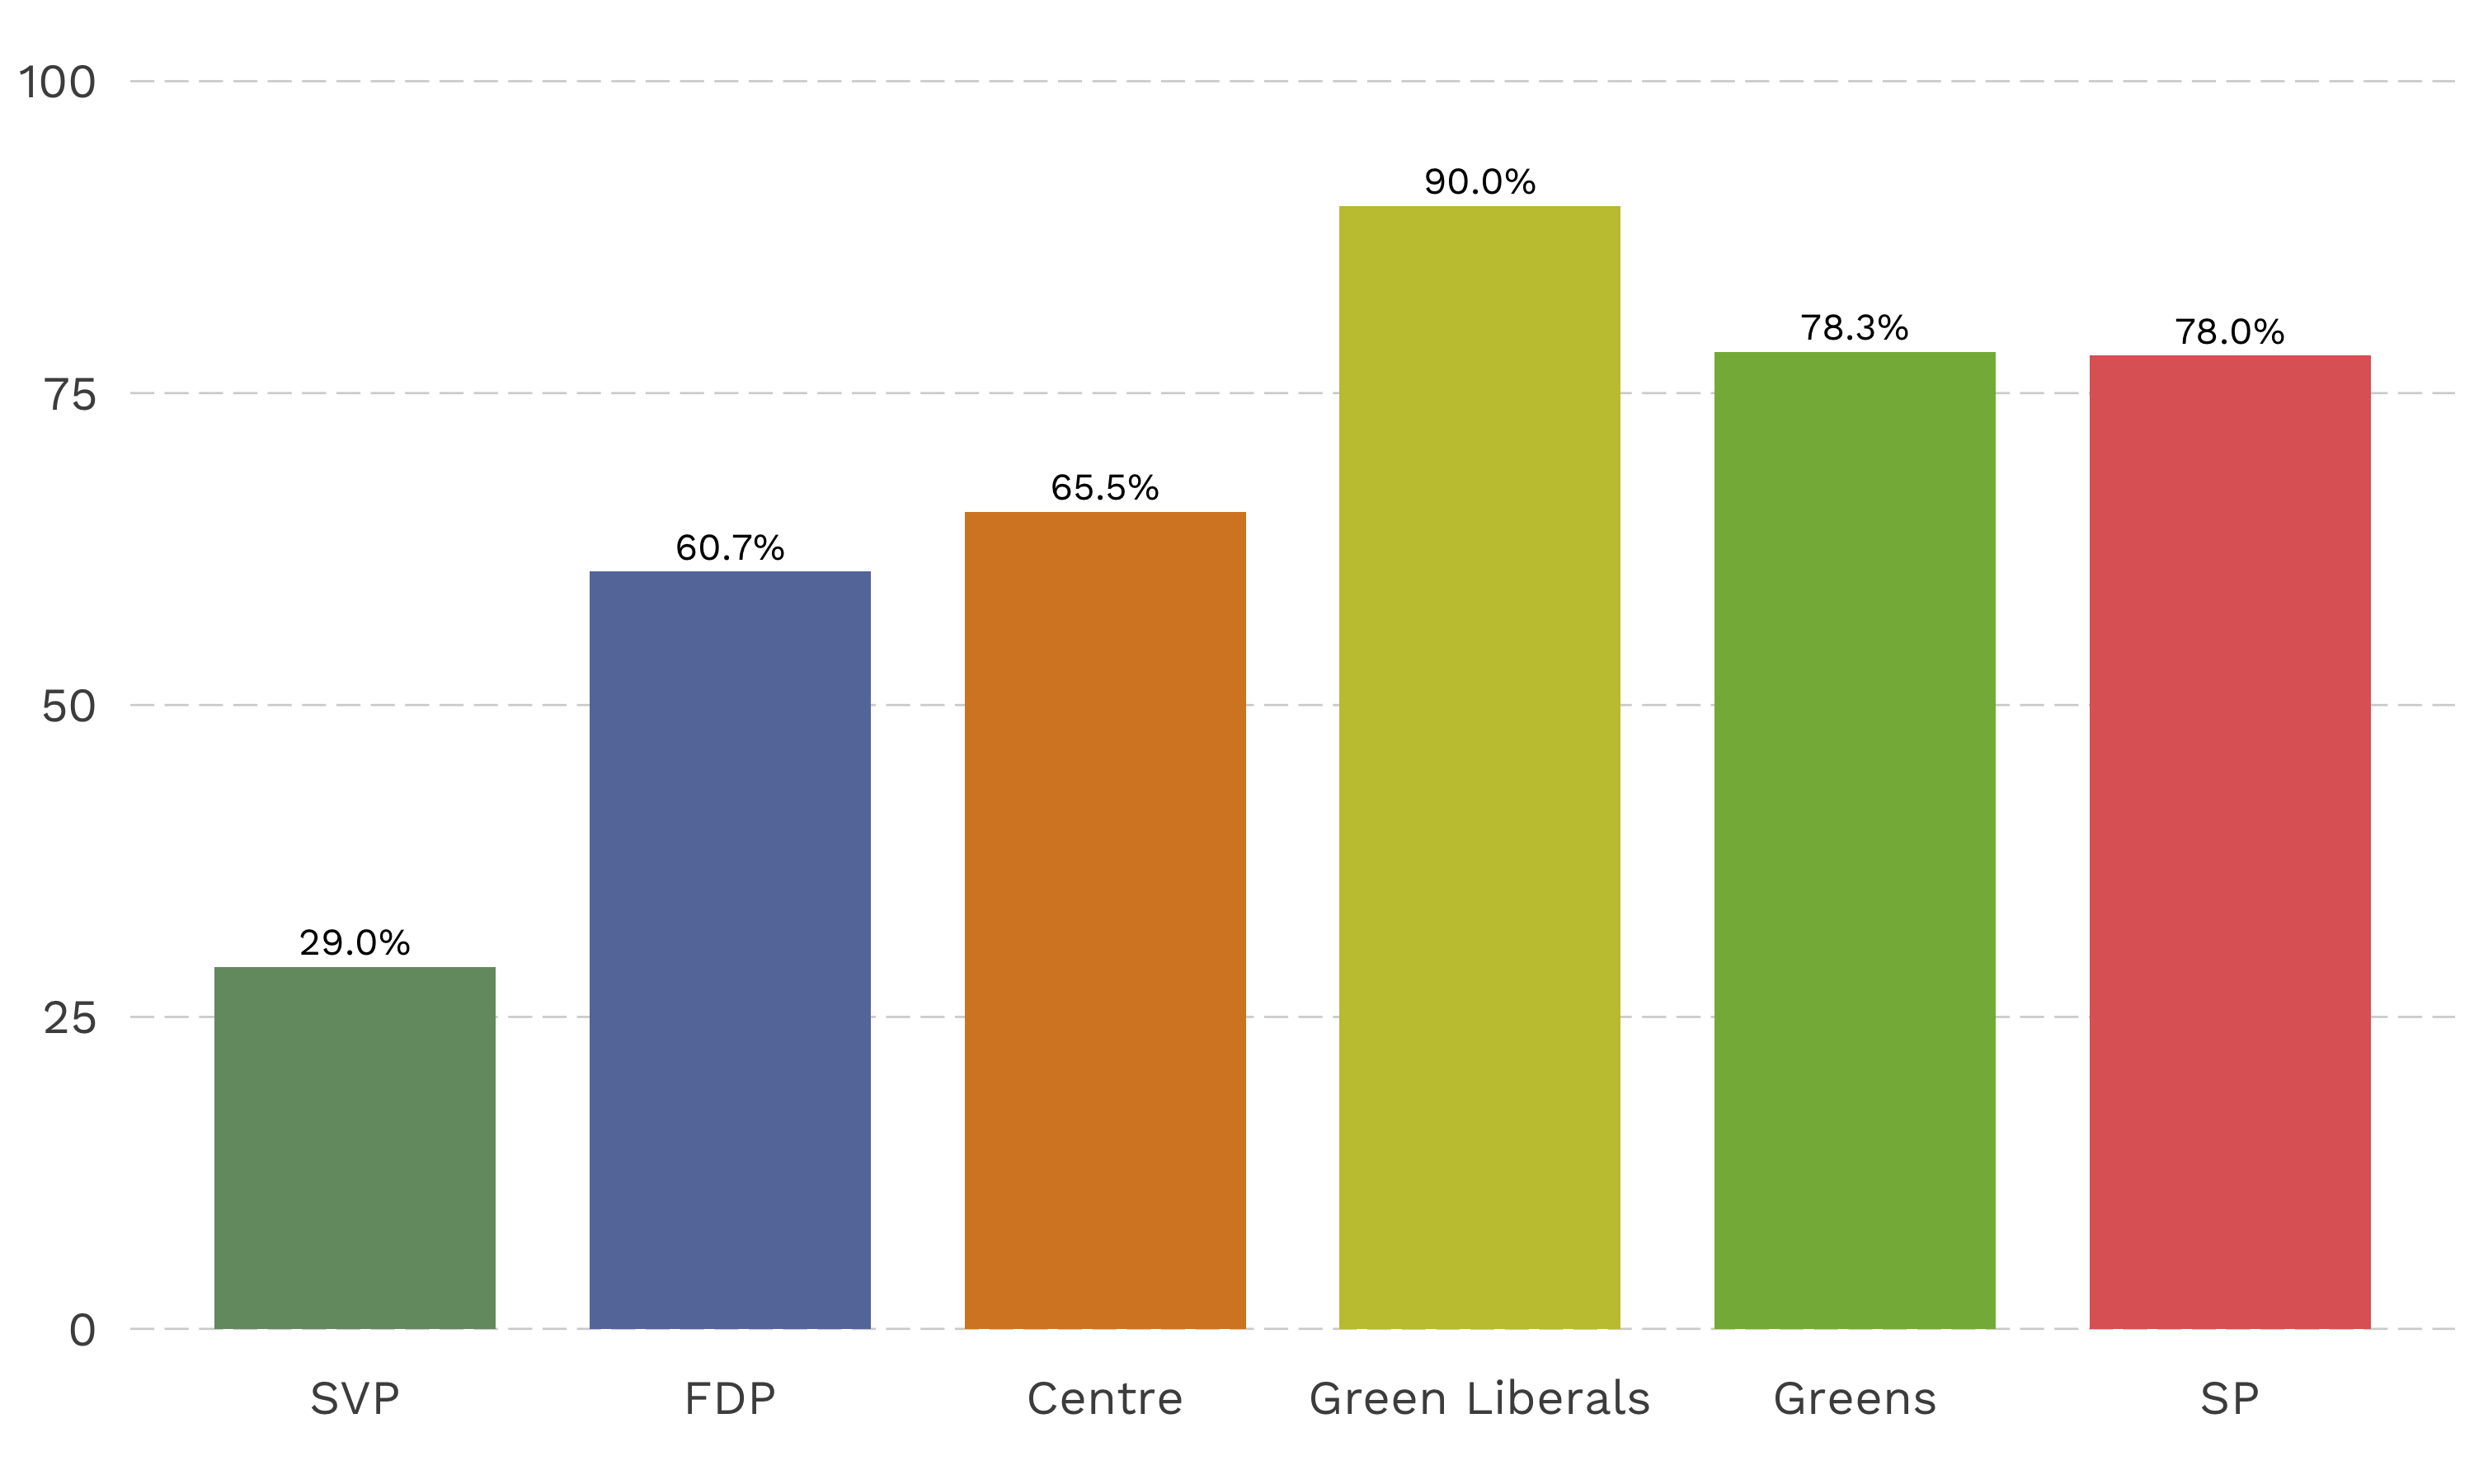
The proportion of academics sitting on the National Council had been falling steadily since the 1990s due to the success of the SVP. This trend continued until 2019 when, for the first time, the proportion of elected members with a university degree increased, largely due to the arrival of a wave of newly elected Greens and Greens’liberals with a university or polytechnic education. In 2023, as a result of the SVP’s return to success, the proportion of university graduates declines slightly, from 60.5% to 58%. Nonetheless, university education continues to be a widespread asset among members of the National Council (Appendix 1). The parties on the centre-right (FDP, Centre and Greens) and the left (SP and Greens) show a very high degree of academisation, while the SVP has by far the lowest proportion of elected members with a university degree (Figure 3).
Figure 3. Members of National Council partisan delegations with a university education (2023), in %
4. Ever more seats for the self-employed and fewer for wage earners
In terms of professional profile, we note that the composition of the National Council has been very stable since the creation of the federal state in 1848 (for more historical details, see also Pilotti 2018, 2022). There are two notable changes between 2019 and 2023: the significant increase in self-employed workers (from 45% to 51.5%) and the significant decrease in wage earners (from 18.5% to 11%) (Figure 4).
Figure 4. Distribution of members of the National Council by professional status (1848 and 2015-2023), in %
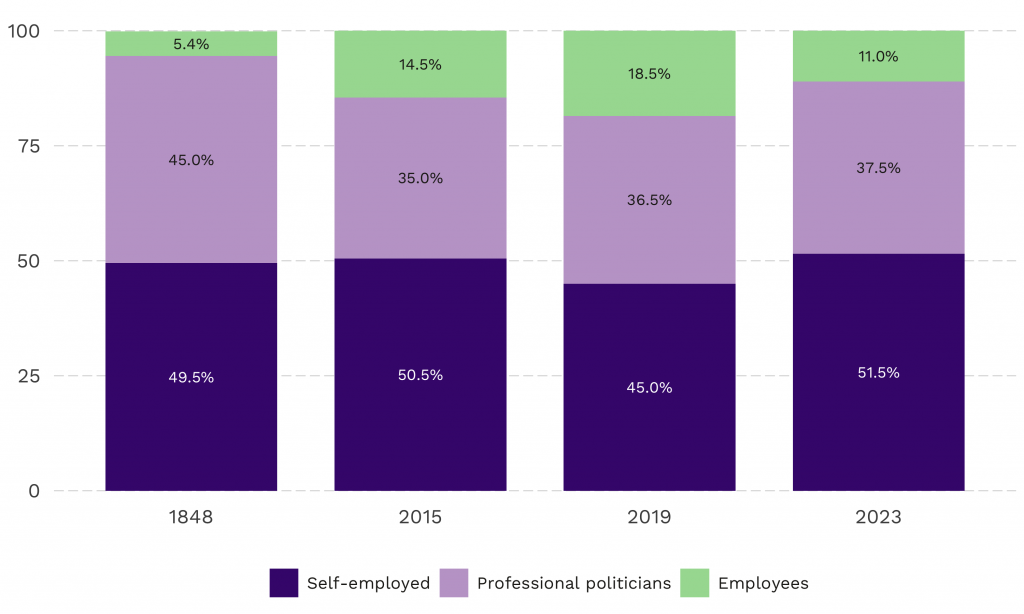
The increase in the number of self-employed is largely due to the success of the SVP, almost all of whose new members (90.5%) come from this professional category. The increase in the number of self-employed is also due to the Centre’s newly elected members, more than half of whom are self-employed.
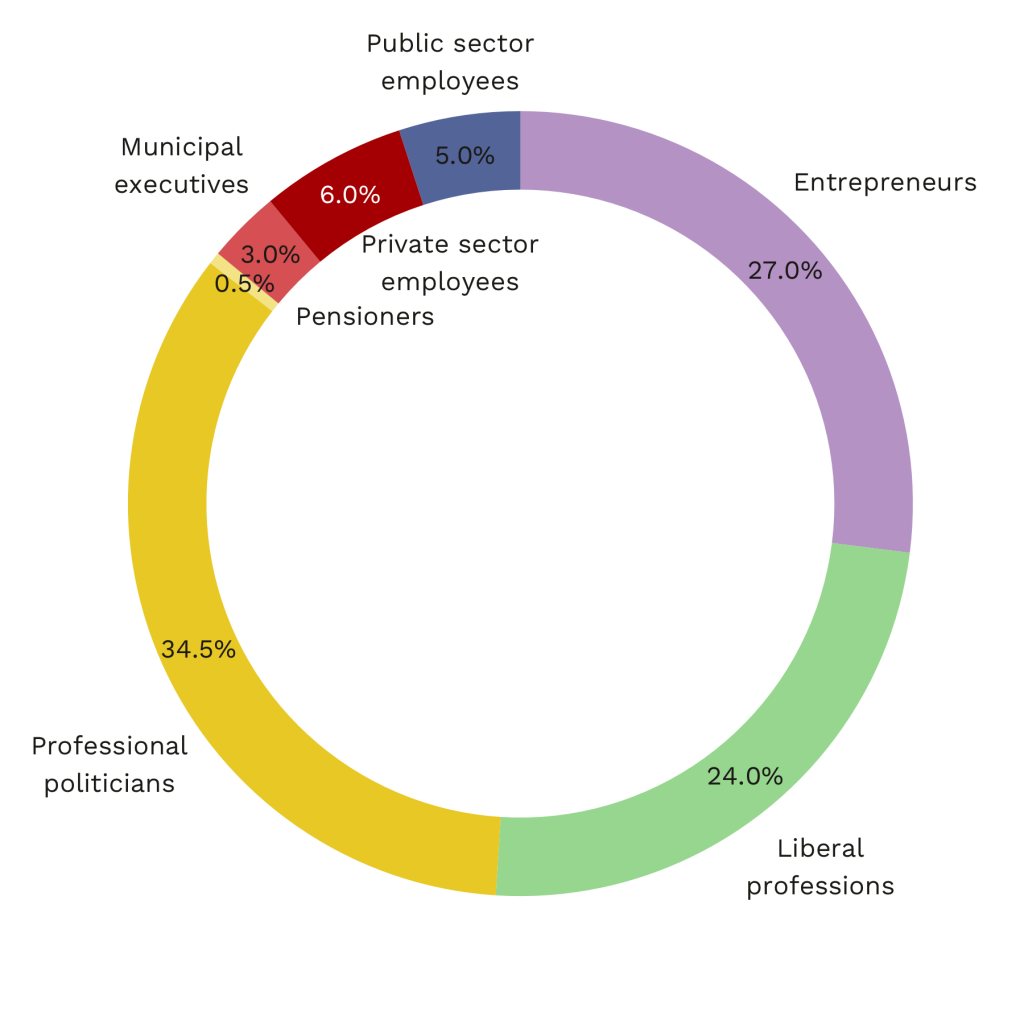
Figure 5 gives a more detailed breakdown of the elected members according to their professional profile. We can see that the National Council is dominated by three main groups. Firstly, the group of political professionals2 (35%), which includes a large proportion of professional MPs, who have seen the biggest increase since 2019 (+5.5 percentage points; see Appendix 2). Secondly, the group of entrepreneurs (27%), whose weight will increase in 2023 compared to the beginning of the last legislature due to the arrival of more farmers (+2.5 percentage points) and entrepreneurs (industry, arts and trades) (+2). Finally, the liberal professions group (24%), in which it is interesting to note the growth in the number of lawyers (+3 percentage points), which, according to data from the Observatoire des élites suisses, is a first since the end of the 1970s (see Pilotti 2017 : 360).
Figure 5. Distribution of National Council members according to professional group in 2023, in %
5. 175 years of the federal state (1848-2023) and significant stability in the professional profile of the National Council
In 2023, we mark the 175th anniversary of the creation of the federal state. A comparison between the very first National Council in 1848 and the one that emerged from the very last federal elections on 22 October 2023 reveals at least four key findings. Firstly, the presence of entrepreneurs (15.3% in 1848 vs. 17% in 2023) and the liberal professions (around 25% on both dates) is still very high. Secondly, the presence of farmers is now almost four times higher in 2023 (10%) than in 1848 (2.7%). Thirdly, within the political professions, members of cantonal executives are disappearing (22.5% in 1848), while in the years 2000 and 2010 there has been a marked increase in the number of professional parliamentarians, due to higher salaries. Finally, the National Council still has little room for wage earners. Even if their share is slightly higher in 2023 than in 1848 (11% vs. 5.4), they are largely under-represented.
Conclusion
An analysis of the social and political profile of the new National Council resulting from the 2023 federal elections highlights the profound and constant social selectivity that characterises the dynamics of parliamentary recruitment in Switzerland.
Although certain indicators have changed since the last elections in 2023, such as the slightly higher average age, the slight fall in the representation of women, and the slight decrease in the number of academics due to the success of the SVP, we find that most of the social characteristics of elected members have persisted since the creation of the federal state in 1848.
The liberal professions and entrepreneurs have maintained a dominant presence in the National Council for 175 years. The presence of farmers, although very much a minority in society, remains very significant. Conversely, employees in the public and private sectors are poorly represented in relation to their demographic weight. This mirror image between members of parliament and the socio-economic reality of the Swiss population raises questions about the ability of elected representatives to reflect the day-to-day problems of the population in the federal arena.
This brief descriptive analysis was carried out on the 200 elected members of the National Council following the federal elections on 22 October 2023. The composition of the National Council will change slightly following the 2nd round of elections to the Council of States. The sample of newly elected members comprises 48 individuals, with the following partisan breakdown: 21 SVP ; 10 SP, 7 FDP, 7 Mitte, 2 MCG et 1 UDF. The sociographic data are taken from the Swiss Elites Database (2015 and 2019) or collected from the personal websites of elected representatives, cantonal chancelleries or sources in the print or online press (2019 and 2023). The sociographic data for 1848 comes from Andrea Pilotti’s personal database. The data collected for 1848, 2015 and 2019 refer to the start of each legislature.
1 This analysis is based on a more comprehensive study available at the following link: Le profil socioprofessionnel du Conseil national (2015-2023)
2 For information purposes, this group includes leaders of business associations, trade union secretaries, members of local authorities and professional parliamentarians.
Appendix
Appendix 1 : Members of the National Council with a university education, by gender (1848 and 2015-2023), in %
| 1848 | 2015 | 2019 | 2023 | |
|---|---|---|---|---|
| Academic | 58.6% | 57.0% | 60.5% | 58.0% |
| Women | – | 61.5% | 63.9% | 68.8% |
| Men | – | 54.8% | 58.1% | 51.2% |
Appendix 2 : Distribution of members of the National Council by profession (1848 and 2015-2023), in %
| Professions | 1848 | 2015 | 2019 | 2023 | Difference 2019-2023 |
|---|---|---|---|---|---|
| Company management | 15,3% | 15,5% | 15,0% | 17,0% | 2,0 |
| Lawyers | 15,3% | 9,5% | 7,5% | 10,5% | 3,0 |
| Pensioners | 6,3% | 1,0% | 0,0% | 0,5% | 0,5 |
| Other liberal professions | 9,9% | 16,0% | 15,5% | 13,5% | -2,0 |
| Managers in the private sector | 0,0% | 8,0% | 9,5% | 6,0% | -3,5 |
| Farmers | 2,7% | 8,0% | 7,5% | 10,0% | 2,5 |
| Managers in associations | 0,0% | 5,0% | 6,0% | 6,5% | 0,5 |
| Executives in NGOs and co-operatives | 0,0% | 1,0% | 1,0% | 0,0% | -1,0 |
| Municipal executive members | 2,7% | 7,5% | 6,5% | 3,0% | -3,5 |
| Cantonal executive members | 22,5% | 1,0% | 0,0% | 0,0% | 0,0 |
| Professional parliamentarians | 0,0% | 21,0% | 21,5% | 27,0% | 5,5 |
| Judges and district councillors | 17,1% | 0,0% | 0,0% | 0,0% | 0,0 |
| Leaders of political parties | 0,0% | 0,0% | 0,5% | 0,0% | -0,5 |
| Journalists | 2,7% | 1,0% | 1,0% | 1,0% | 0,0 |
| Teachers | 1,8% | 2,0% | 6,5% | 4,0% | -2,5 |
| Public service executives | 3,6% | 3,5% | 2,0% | 1,0% | -1,0 |
Appendix 3 : Distribution of National Council members by profession (2015-2023), by gender, in %
| 2015 | 2019 | 2023 | ||||
|---|---|---|---|---|---|---|
| Professions | Men | Women | Men | Women | Men | Women |
| Company management | 19,3% | 7,7% | 21,4% | 6,0% | 22,0% | 9,1% |
| Lawyers | 11,1% | 6,2% | 10,3% | 3,6% | 13,8% | 5,2% |
| Pensioners | 0,7% | 1,5% | 0,0% | 0,0% | 0,8% | 0,0% |
| Other liberal professions | 14,1% | 20,0% | 12,0% | 20,5% | 9,8% | 18,2% |
| Managers in the private sector | 8,9% | 6,2% | 11,1% | 7,2% | 7,3% | 3,9% |
| Farmers | 9,6% | 4,6% | 10,3% | 3,6% | 12,2% | 6,5% |
| Managers in associations | 5,9% | 3,1% | 5,1% | 7,2% | 7,3% | 5,2% |
| Executives in NGOs and co-operatives | 0,0% | 3,1% | 0,0% | 2,4% | 0,0% | 0,0% |
| Municipal executive members | 9,6% | 3,1% | 7,7% | 4,8% | 3,3% | 2,6% |
| Cantonal executive members | 1,5% | 0,0% | 0,0% | 0,0% | 0,0% | 0,0% |
| Professional parliamentarians | 12,6% | 38,5% | 12,0% | 34,9% | 21,1% | 37,7% |
| Judges and district councillors | 0,0% | 0,0% | 0,0% | 0,0% | 0,0% | 0,0% |
| Leaders of political parties | 0,0% | 0,0% | 0,0% | 1,2% | 0,0% | 0,0% |
| Journalists | 0,7% | 1,5% | 0,9% | 1,2% | 0,0% | 2,6% |
| Teachers | 2,2% | 1,5% | 6,8% | 6,0% | 2,4% | 6,5% |
| Public service executives | 3,7% | 3,1% | 2,6% | 1,2% | 0,0% | 2,6% |

